Summary
 The Pennsylvania Oil and Gas Waste Mapping Tool includes interactive visualizations that show waste generation and handling from oil and gas development in Pennsylvania as reported to the Pennsylvania Department of Environmental Protection (PADEP). Data from 2015 – 2021 is now available in the Updated PA Waste Visualization Tool.
Data presented in the interactive visualizations below are also evaluated in Hill et al., 2019. Click below to view oil and gas waste generation by county and oil and gas waste handling locations and handling methods across Pennsylvania and neighboring states.
Quick Tips
- For a deeper view of specific maps or data: Select individual tabs.
- To explore connected visualizations: Select dashboard view.
- For a full-screen visualization: Click on the full-screen icon at the bottom right corner of a tab

- To download images or data from an individual plot or map: Click on the download icon at the bottom right of that figure.

- To undo all filters: Click on the revert icon at the bottom right corner of a tab.

- To embed or share a link to a specific map view: Click the connections icon on the bottom right of your map results.

- To re-center maps: Click on the home icon, which appears when you hover in the top left corner.

- Use the glossary to look up terminology: The Glossary and Sources page includes definitions and data sources.
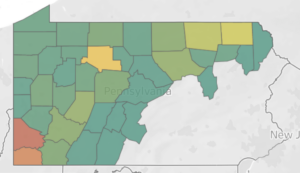
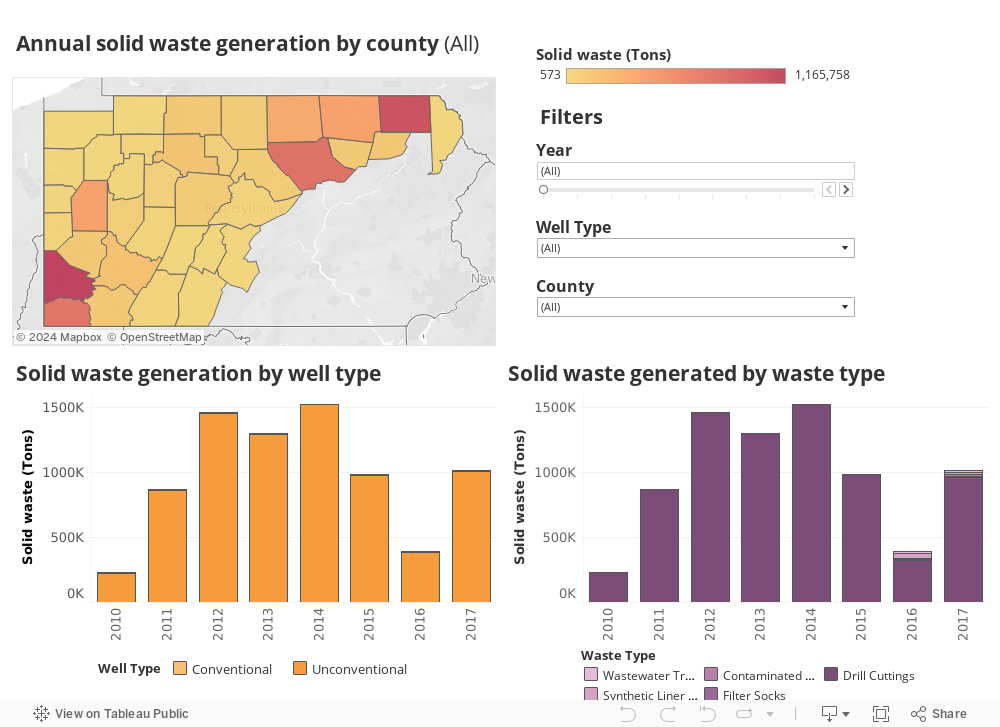
Waste Generated from Oil and Gas Development in Pennsylvania
Explore wastewater and solid waste generated by oil and gas development in Pennsylvania by county, by well type, and by waste type. Hover over visualizations to see annual volumes or quantities and the number of wells responsible for generating waste. Wastewater is reported in barrels (bbl) and solid waste is reported in tons. Briefly, unconventional wells tap into unconventional source rock formations (e.g., the Marcellus shale) and employ extraction techniques such as high-volume hydraulic fracturing (e.g., fracking). Conventional wells produce from conventional formations, and may or may not use hydraulic fracturing to extract oil and gas.

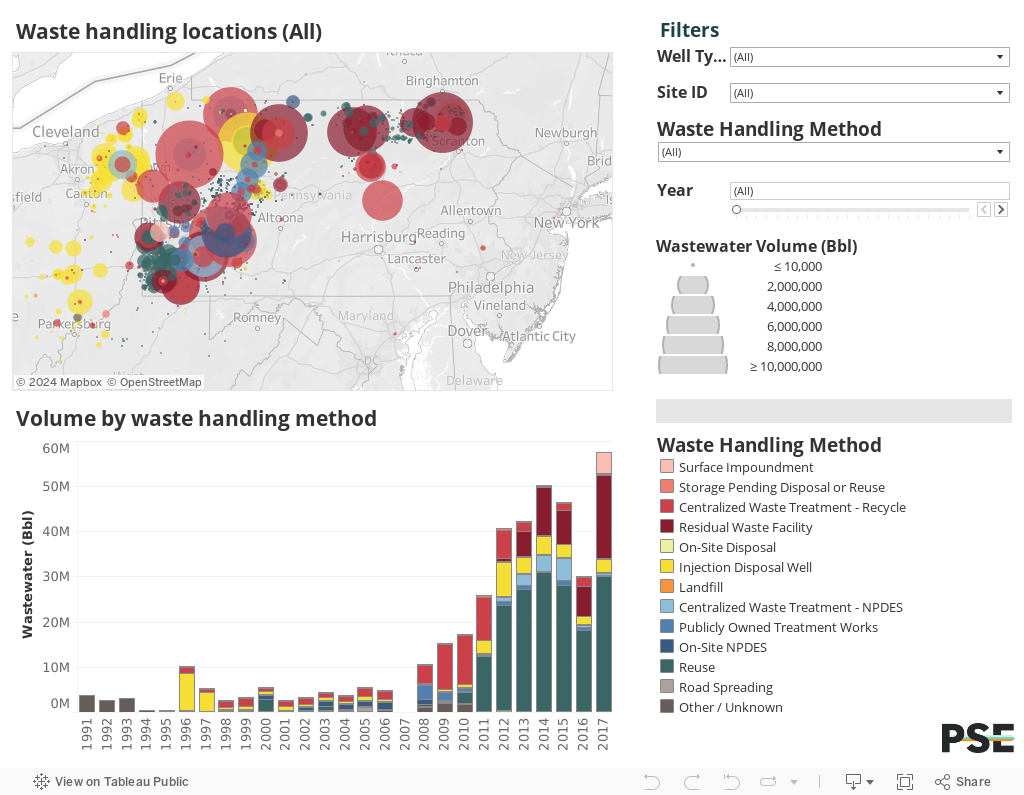
Oil and Gas Waste Handling Locations
Explore wastewater and solid waste generated by oil and gas development in Pennsylvania by county, by well type, and by waste type. Hover over visualizations to see annual volumes or quantities and the number of wells responsible for generating waste. Wastewater is reported in barrels (bbl) and solid waste is reported in tons. Briefly, unconventional wells tap into unconventional source rock formations (e.g., the Marcellus shale) and employ extraction techniques such as high-volume hydraulic fracturing (e.g., fracking). Conventional wells produce from conventional formations, and may or may not use hydraulic fracturing to extract oil and gas.

Notes
- The database of oil and gas waste used for these visualizations was compiled by the Pennsylvania Department of Environmental Protection (PADEP). For more details visit: https://www.paoilandgasreporting.state.pa.us/publicreports/Modules/Welcome/WasteFacilityReport.aspx
- PADEP suffered an unrecoverable data loss in 2007, explaining the limited waste generation and waste handling data available for this year.
- While waste generation data reported to PADEP begins in 1991, spatial information is not available until 1995. As such, the waste generation visualization includes data from 1991 to 2017 and the waste handling visualizations show data from 1995 to 2017.
- The spatial visualizations (maps) are limited to waste records that included verifiable spatial information. The bar graph visualizations include all wastewater volumes reported to PADEP, regardless of if spatial information was included.
- Road spreading was often reported at the municipality or county level. Road spreading wastewater volumes reported at the municipal or county level are captured in the bar graph visualization, but are not shown in the mapping visualization.
- Over time, a single waste handling location (e.g. facility or well) could be reported with multiple waste handling methods. While facilities could change over time with upgrades and new permitting, we assumed that the waste handling method was consistent across a calendar year. To address this, we visualize the facility- or well-specific waste handling method reported most frequently for each year.
- Approximately 94% of solid waste generated between 2010-2017 was disposed of in landfills; as such, only landfills are shown in the solid waste handling visualization.
Contact Us
For questions, comments, or to report any errors in the data or trouble with the Pennsylvania Oil and Gas Waste Mapping Tool, please ask Lee Ann Hill at: lhill@psehealthyenergy.org. These reported data are accurate to the best of our knowledge, but there may be errors in data reporting and data compilation. We would appreciate any input if you notice any anomalies or inaccuracies to help improve this visualization. We are also eager to help you navigate and use the tool, so please reach out if we can help you these visualizations to answer any specific questions!
@PhySciEng
Energy costs are a persistent burden for low-income communities. Recent research from @PhySciEng @IEERArjun on behalf of @COEnergyOffice offers a suite of strategies to align affordability, equity, #publichealth, and #climate goals.
https://www.psehealthyenergy.org/our-work/publications/archive/…
Stay informed!
Join our email list to receive updates
on PSE’s work and news.